As 2017 draws to a close, it’s a great time to look back and see how optometrists made out financially. According to our annual income survey, 2016 was a year of growth for optometrists, with increases across the board. This year, more than 500 ODs responded to our survey, and the overall average income was $163,761, a 4% increase from 2016. That’s not as significant as the 9% increase from 2015 to 2016, but it shows things are moving in the right direction.
Beyond that, we broke down the results to incorporate a range of factors and see exactly what affected wages throughout the field. Here’s how it played out.
 |
| Click graph to enlarge. |
Part-time Prosperity
Most of this survey’s statistics focus on full-time work, but it’s important to look at part-time work as well. This year, part-time optometrists only accounted for 9% of respondents (a 1% decrease from 2016), and they earned an average of $120,841, a 10% increase from the year before and a 44% increase from 2015. Full-time optometrists—91% of respondents—experienced a more modest increase in average salary, with their $167,562 representing about a 3% increase from the previous year.
The most important factor in the increased pay for part-time work was experience, as 57% of part-time respondents had more than 20 years in the profession.
 |
Hard Work Pays Off
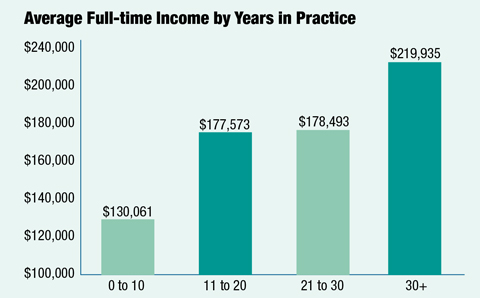
Over the years, the general rule of thumb in our income survey has been that the more experience you have, the better, and while that remains true for 2017, your experience threshold is becoming a bigger factor. The entry-level group of optometrists—those with zero to 10 years of experience—made an average of $130,061, only a slight increase from 2016. This year’s average income leap from zero to 10 years of experience to 11 to 20 years was a sizable 37% for $177,573. For optometrists with 21 to 30 years of experience, however, the average income was $178,493. That’s only a 0.5% increase for 10 years more experience.
This mid-career plateau was a source of frustration for many in the 21 to 30 year group. One respondent says that her income had not changed in 10 years, and according to another: “I’ve been doing this for 25 years and I’m making less money than I did 15 years ago.”
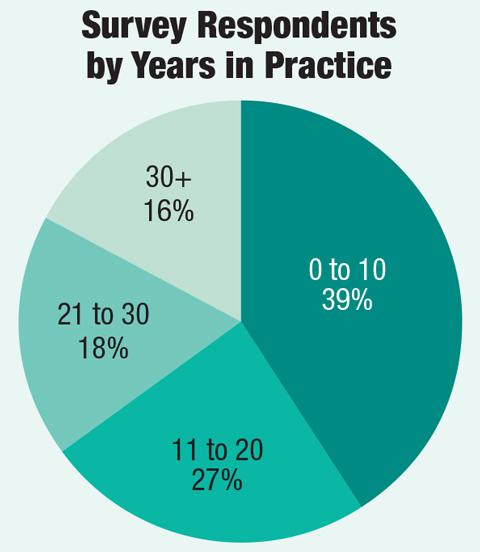
Still, it appears that increased experience pays off eventually. At the top of the experience pack were those with more than 30 years in the profession. The group represented only 12% of respondents but made an average salary of $219,935, a 23% rise from those who stalled out between 21 and 30 years. “Beyond my wildest dreams,” was how one 30-plus-year respondent described his earnings. Others were satisfied with their comfortable lifestyles and ability to stay on track for retirement.
 |
| Click graphs to enlarge (above and below). |
 |
A Boost for Employees
In 2016, whether you were employed or self-employed was the biggest factor affecting optometrists’ income. It remained vital in this year’s results, but the divide is beginning to close. This year, self-employed optometrists reported an average income of $179,078 compared with $132,353 for those who are employed. The 35% difference between the two is noteworthy, but much less so than the 58% gap of 2016. Additionally, many respondents are touting the benefits of being employed.
“I have had a private practice in the past, but my current practice mode has far fewer headaches and more flexibility for vacations with other doctors available,” says one employed respondent. “I now also have a 401k plan with a match and medical insurance.” Another respondent reports, “My employer pays my family’s entire health insurance premium, as well as stipends for continuing education and other incidentals.”
It’s not all positives on the employed side of the equation, however. “I am employed, so my income is a flat rate, regardless of my production,” says one respondent. “There are bonuses that reflect my production, but the goal keeps rising to impossible levels. I had a great year in 2016, but that only meant goals rose to levels that were not attainable for 2017.” Another respondent, who answered the survey as “satisfied” with his current salary as opposed to “very satisfied,” listed one of the pitfalls of his employment: “I would be ‘very satisfied’ if I got paid for ‘non-revenue’ visits, especially cataract post-ops, since I do hundreds a year.”
Self-employment brings on a new wave of obstacles. Among those most frequently mentioned in the survey were low insurance reimbursements and competition from online sales. When it’s possible to work around those factors, however, the benefits of self-employment are not to be overlooked. “I earn about three times the national average, but to get there I work six days and 56 hours per week,” says one respondent. “This affords me enough money to live comfortably, vacation six weeks per year, save for retirement and donate.”
Other survey takers mentioned similar perks: “I am able to work three days a week,” says one respondent. “My practice has an administrative staff to handle most day-to-day decisions, while I focus on reports and ‘big picture’ items.” According to another: “I work about 36 hours per week, my office is half a mile from my home and overall I am happy with the income I make.”
Practice Setting Pluses
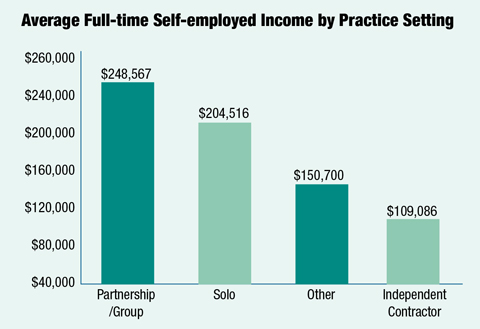
To maximize potential income, working in a partnership or group seems to be the way to go for ODs. The 30% of self-employed respondents who worked full-time in a partnership or group had an average income of $248,567, the highest reported figure of any group in this year’s survey—and a 6% increase from last year’s results, in which partnership or group ODs also reported the highest average income at the time.
Those who chose to forego the partnership or group route and operate a solo practice experienced a healthy 7% income jump in 2017, with an average of $204,516. It wasn’t a great year for independent contractors, however. The group reported the lowest full-time income average of our survey at $109,086, a 27% drop from 2016.
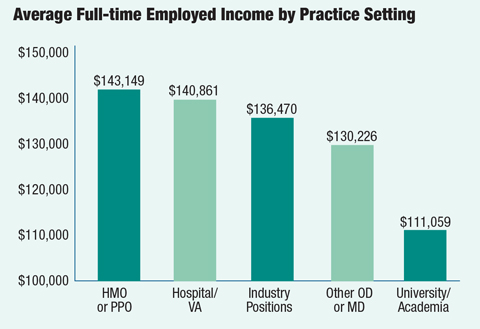
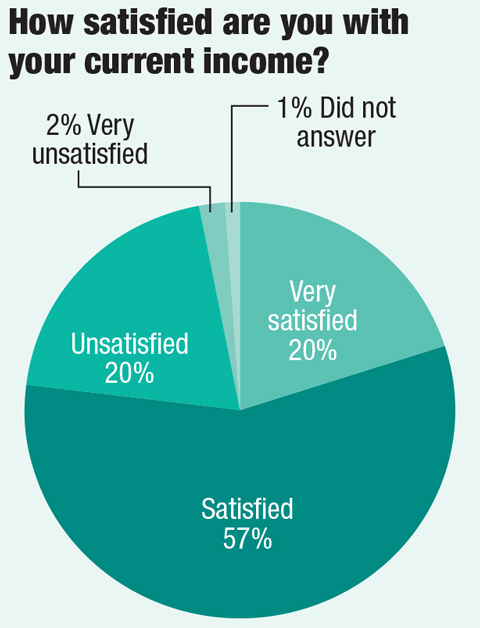
Overall, self-employment seems to be a rewarding direction, as 27% of those respondents were very satisfied with their income, compared with only 14% of employed respondents. That isn’t to say that 2017 was a bad year to be employed. In particular, it was a good time to work in an HMO or PPO setting, as the group took over the top average employee salary spot at $143,149, thanks to an 8% boost. However, these ODs only accounted for about 4% of employed respondents.
Employees who work in a hospital or Veteran Affairs setting, those who work for another OD or MD, and those who work in academia experienced notable growth as well, with 11%, 18% and 12% increases in salary, respectively. Although working in academia delivers the lowest average salary for the employed, it appears to be a fulfilling mode of work, as nearly 70% of those respondents were either satisfied or very satisfied with their salary. Some reported perks here included schedule flexibility and benefits.
One dark spot for the employed, however, was compensation from industry positions. This group lost the top spot for average employee salary as the number dropped by about 10% from 2016. Making this statistic slightly more concerning is the fact that industry position employees account for 21% of employed respondents, the second largest group behind only those who work for another OD or MD (50% of employed respondents). Survey comments did not establish a standout reason for the drop off, but it is cause for concern nonetheless.
 |
| Click graphic to enlarge. |
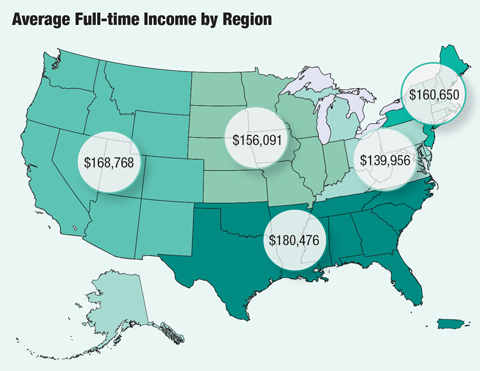
Regional Riches
Your practice location appears to be more important than ever based on this year’s results, and it could alter your pay by up to 29%. The place to be, it seems, is the South. There, ODs earn an average income of $180,476, a stark contrast to the nation’s low of $139,956 in the Mid-Atlantic and Lower Great Lakes region.
The West experienced the greatest upswing of the bunch, as ODs in these states went from the lowest paid in the nation last year to second highest paid this year. This is especially helpful for those living in California, who reported struggling with the area’s high cost of living in past surveys. This year, Calidornia-based respondents moved up 18 percentage points for an average income of $181,612. “It’s enough, but the cost of living in California is high, so there is still room for improvement,” says one respondent.
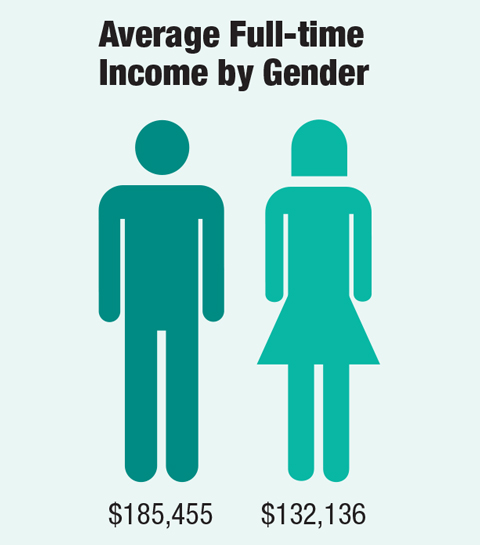 |
The Gap Expands
The gender gap isn’t new to optometry, or any profession for that matter. Last year, we took a big step towards equality, with the disparity between men and women shrinking from 68% to 37% in our survey. If 2016 represented a step in the right direction, 2017 will go down as a step backwards. Results show that men out-earned women by 40% in 2017, a 3% bigger gap than 2016.
One bright spot in last year’s gender-based statistics was the fact that the majority of the disparity came from those with more than 30 years in the field; women with less than 10 years of experience, who accounted for a much larger percentage of respondents, had pulled to within three percentage points of equal pay.
This year, at an average income of $204,903, men with more than 30 years under their belts earned 10% more than women with the same experience, who sat at $186,265. This actually demonstrates a closing of the gap, as this group’s disparity was 33% in 2016. Still, only seven of the group’s respondents were women, so those with less experience gave us a better idea of where we are headed.
 |
Unfortunately, for the group that came so close to equality in 2016, the gap widened again. Like last year, women made up the majority of optometrists with less than 10 years of experience, accounting for 54% of respondents. Their $121,892 average income, however, was 11% less than men in the same group, who earned $135,398. When compared with last year’s meager 3% gap, this represents a sizable step backwards, as the optometrists of the future reported a wider gender gap than those with the most experience.
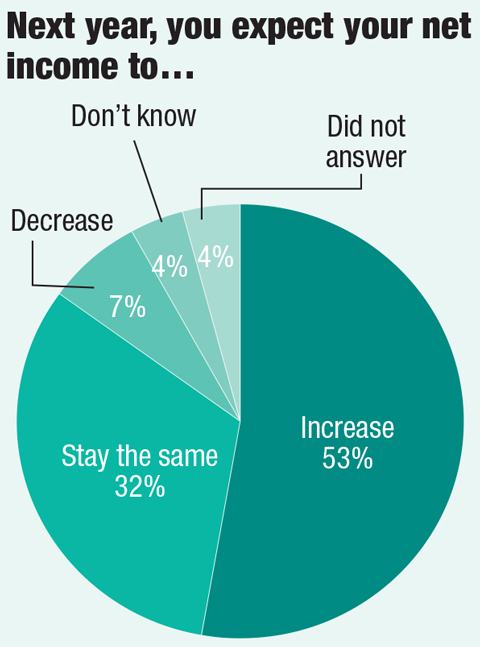
Time to Shine?
Despite this year’s mixed results, ODs were even more optimistic about the year to come. Of this year’s respondents, 53% expect their net income to increase, compared with 47% in 2016. Additionally, 32% expect their income to stay the same, while only 7% expect a decrease. For those looking forward to 2018, technology investments and debt payoff are key.
 |
“I just need to pay off some debt for equipment loans and I should be able to pay myself better,” one respondent says.
For others, it’s simply a matter of adjusting for business changes. “I’m in a transition phase, so my 2017 salary is significantly lower than 2016 as I work to build a new associate into the practice.”
Still Advancing
The 2017 numbers were all over the place for ODs, with some steps backward, some forward and some just side-to-side. Several of the same issues that have haunted the profession for years, such as low insurance reimbursements, remain prevalent, the gender gap appears to have widened again and there’s a pesky mid-career plateau to worry about. However, with an overall increase in average income and some significant growth reported in other categories, the bottom line is that the profession is moving forward, even if the pace has slowed a bit.